Whether you’re a medical student or you’ve been practicing as a physician for years, income stats can help provide more insight into your career.
Several factors can impact doctors’ salaries, from location and specialty to the setting in which they practice
So, how much do doctors make?
We’ve combed through the latest income reports and survey data to provide you with key stats on how much physicians earn.
What Is the Average Salary for Doctors?
According to the Bureau of Labor Statistics, the national average physician salary is $248,640, and the average hourly rate is $119.54
However, average doctors’ salaries vary by location, specialty, and the type of practice in which they work.
For example, the average family medicine physician earns $255,000 per year, while plastic surgeons have an average annual salary of $619,000, based on Medscape’s 2023 Physician Compensation Report.
Physician Salaries by Location
With the cost of living and demand differences across the country, location can have a significant impact on a doctor’s earning potential.
That’s why some doctors choose to practice in more rural areas that have a lower cost of living and more pressing demand for their specialty.
We’ve broken down income data at the state and city level below.
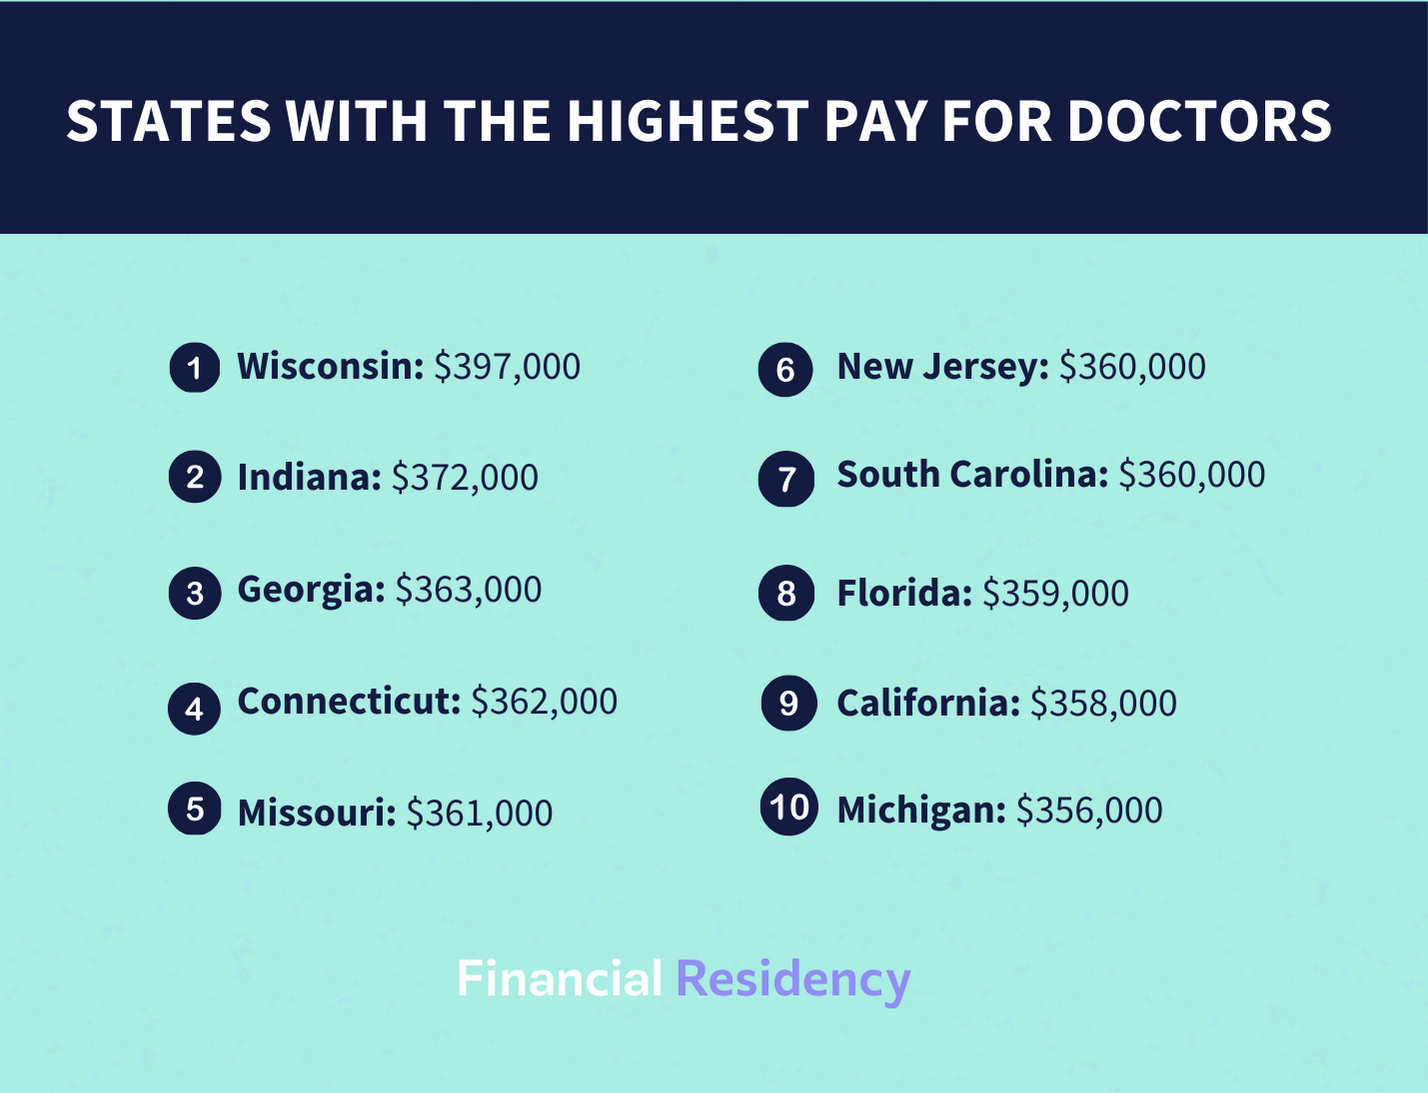
Doctor Salaries by State
According to Medscape’s 2023 Compensation Report, Wisconsin is the highest-earning state for doctors. Physicians there make an average of $397,000 per year.
Here’s an overview of the top 10 states based on physician income.
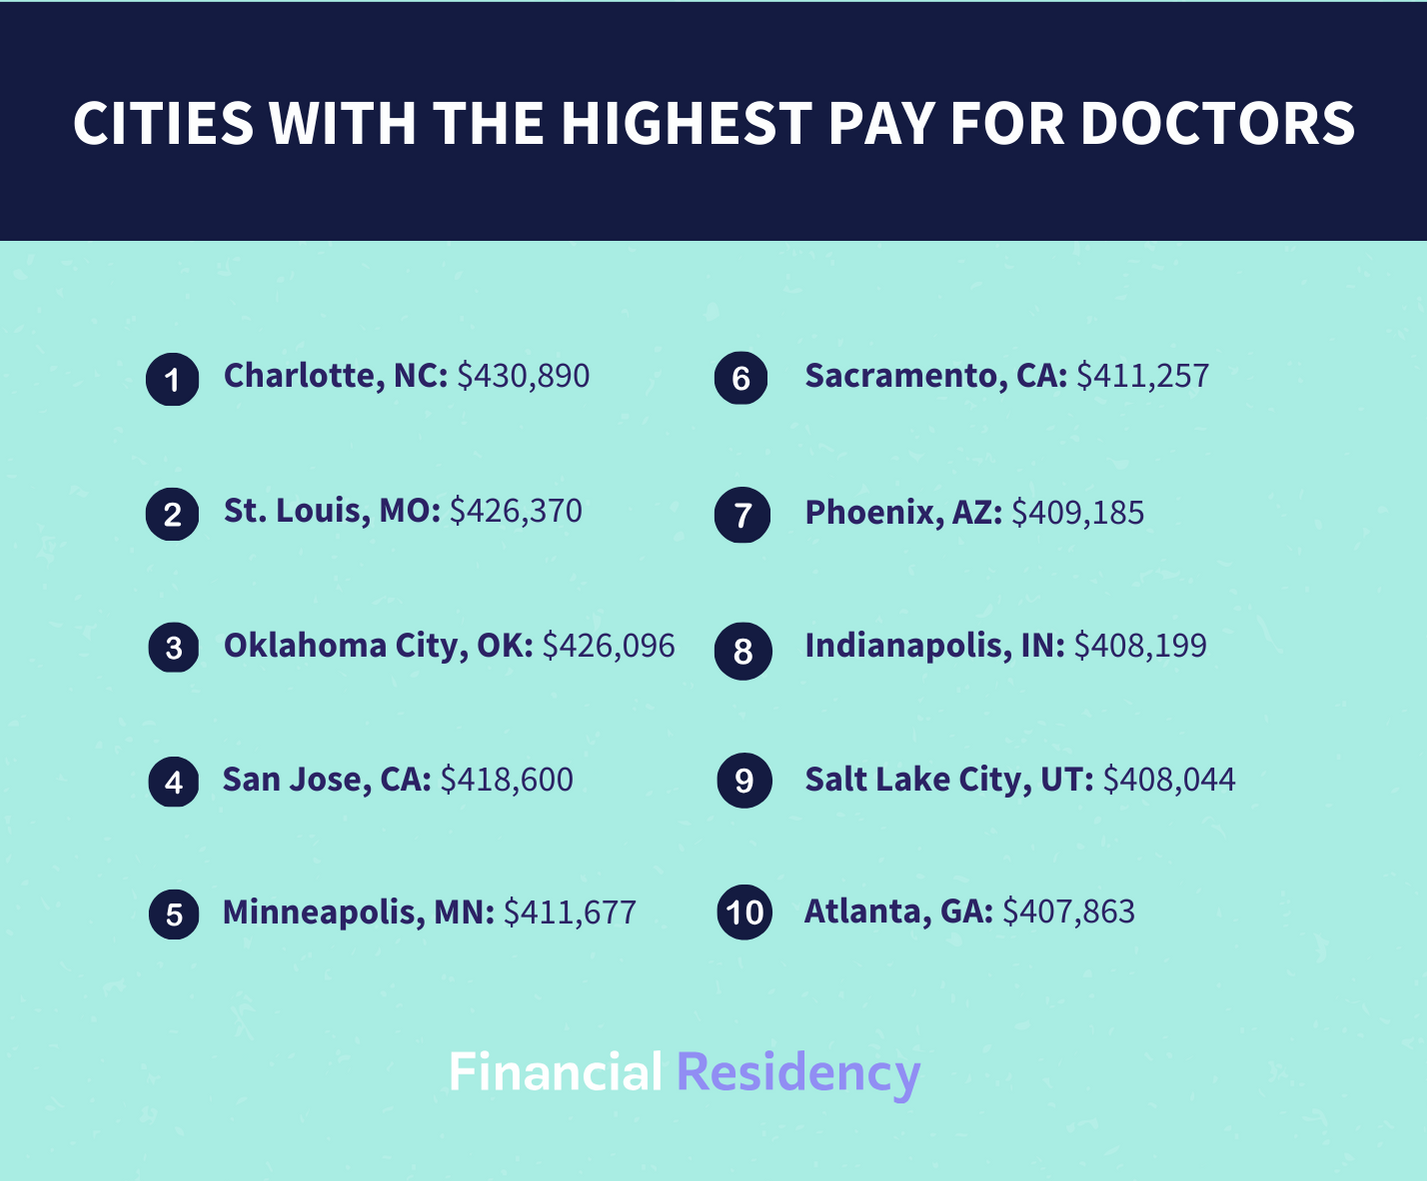
Doctor Salaries by City
Doctors in Charlotte, NC, have the highest salaries in the country, earning an average of $430,890.
Here’s a look at the cities with the highest average income reported by doctors in Doximity’s 2023 Compensation Report:
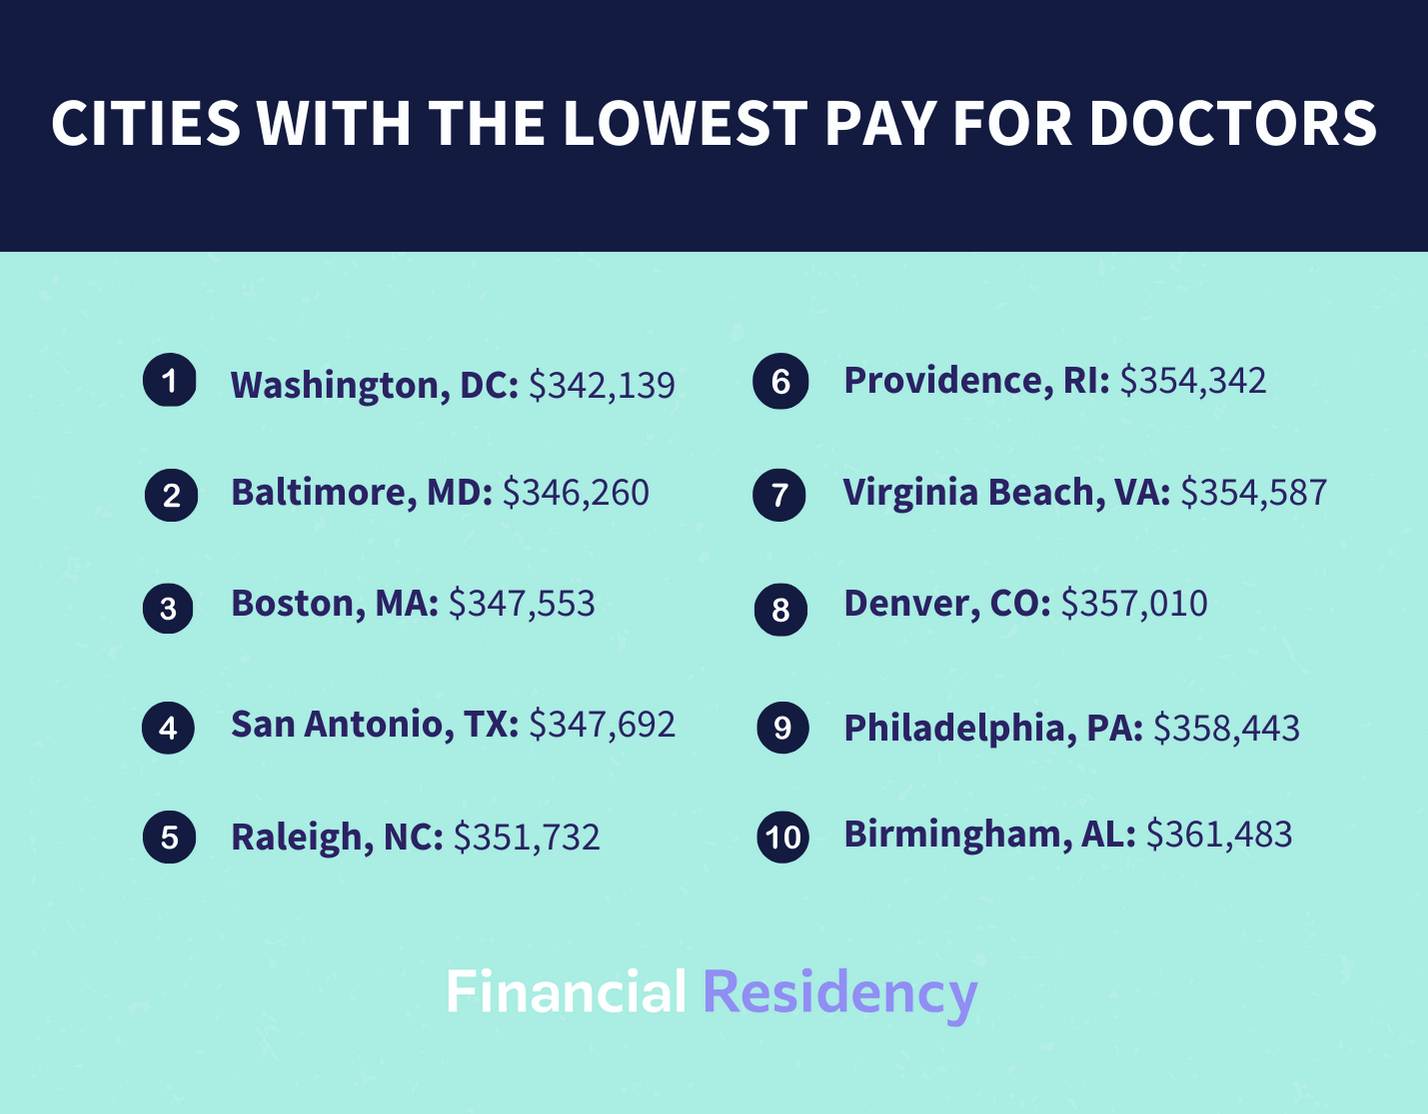
On the opposite end of the spectrum, doctors in Washington, DC earn the lowest income in the nation, making an average of $342,139 annually:
Physician Salaries by Specialty
Geography isn’t the only factor that determines a doctor’s income. The pay gap between different specialties can be significant.
It’s important to note that income data from surveys aren’t necessarily illustrative of the entire industry.
While results can vary from one survey to the next and several factors are at play, we can still look to this data for some baseline estimates of what doctors earn across different specialties.
Based on Doximity’s survey of 190,000 physicians nationwide, here are the highest and lowest-paying specialties.
Top 10 Highest Paying Specialties
| Specialty | Average Pay |
| Neurosurgery | $788,313 |
| Thoracic Surgery | $706,775 |
| Orthopedic Surgery | $624,043 |
| Plastic Surgery | $571,373 |
| Vascular Surgery | $557,632 |
| Oral and Maxillofacial | $556,642 |
| Radiation Oncology | $547,026 |
| Cardiology | $544,201 |
| Urology | $505,745 |
| Radiology | $503,564 |
Neurosurgeons have the highest annual compensation per year of any specialty, and pediatric endocrinologists are the lowest paid, on average.
However, it’s important to note that there are also intra-specialty income discrepancies. There are several steps you can take to advance in your specialty and maximize your salary.
Learn More:
Top 10 Lowest Paying Specialties
| Pediatric Endocrinology | $218,266 |
| Pediatric Infectious Disease | $221,126 |
| Pediatric Rheumatology | $226,186 |
| Pediatric Hematology and Oncology | $237,005 |
| Pediatric Nephrology | $238,208 |
| Pediatrics | $242,832 |
| Medical Genetics | $244,107 |
| Pediatric Pulmonology | $263,742 |
| Medicine/Pediatrics | $270,396 |
| Family Medicine | $273,040 |
As you can see, pediatric specialties rank among the lowest paid in the medical field.
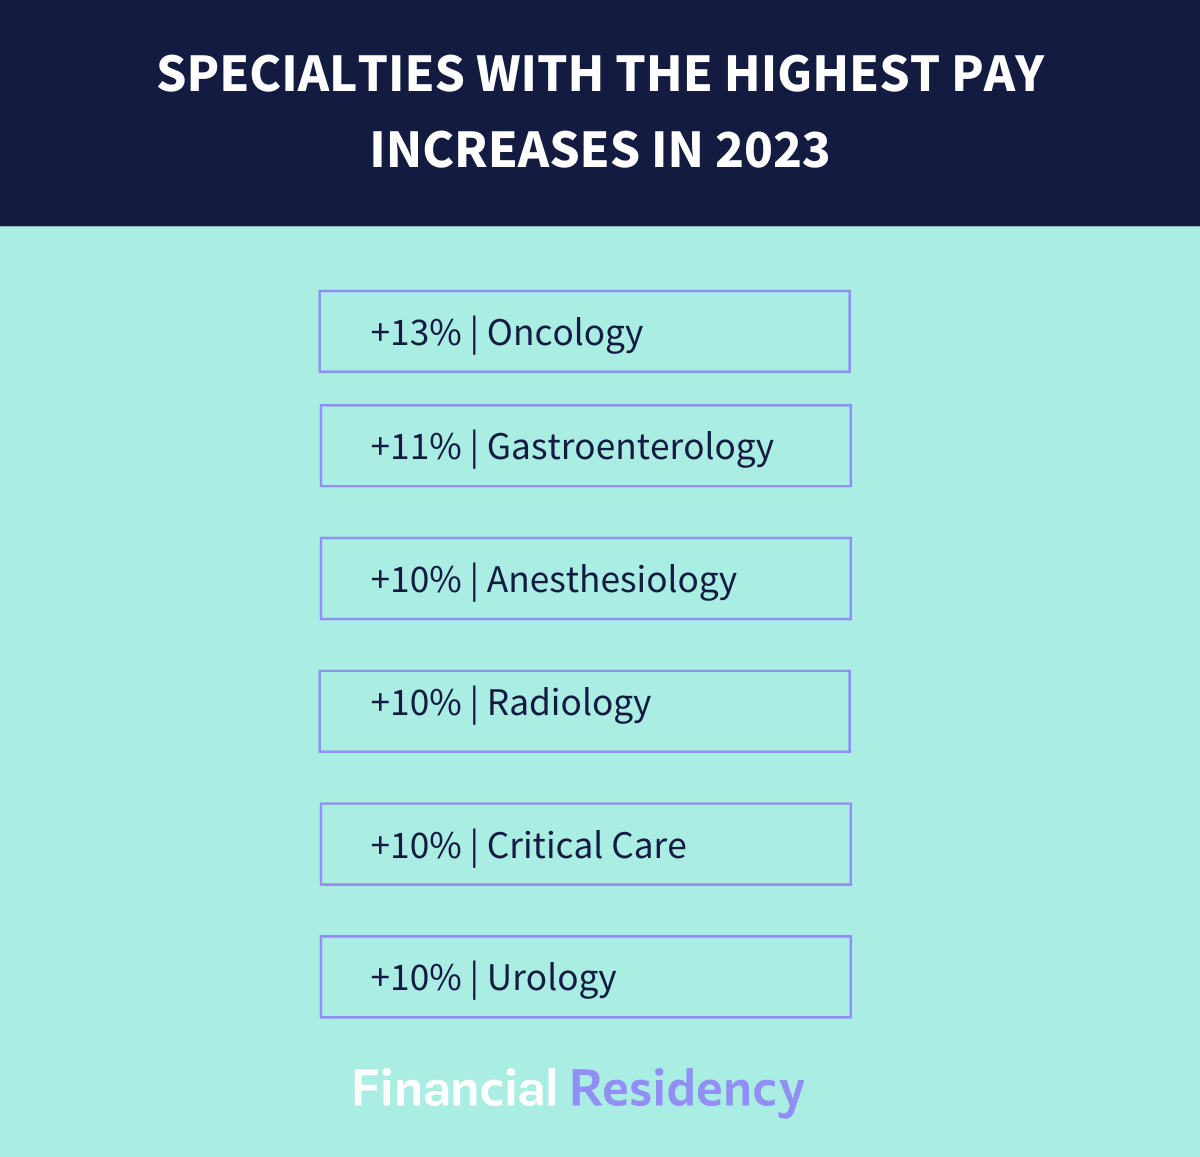
Specialties with the Highest Increase in Income
In 2023, oncology saw the highest income growth overall. These are the specialties that experienced the most significant pay increases:
Physician Salaries by Type of Workplace
Your employment setting can also drastically impact how much you earn as a doctor. Doximity’s survey shows that all practice types remained flat or saw a slight decrease in income in 2023.
Below, we’ll take a look at the average income of physicians in various employment settings, based on Doximity’s findings:
| Type of Practice | Average Income |
| Single specialty physician group | $438,959 |
| Solo practice | $428,112 |
| Physician group with multiple specialties | $421,159 |
| Health system, Integrated Delivery Network (IDN), Accountable Care Organization (ACO) | $400,207 |
| Hospital | $398,954 |
| Pharmaceutical or industry | $392,534 |
| Health maintenance organization | $387,393 |
| Academic setting | $347,013 |
| Government setting | $269,189 |
| Urgent care center or chain | $264,727 |
Attitudes
68% of psychiatrists feel that they’re fairly compensated for their work, the highest percentage of any medical specialty.
68% of psychiatrists surveyed by Medscape said they feel fairly compensated, which is higher than any other specialty. On the opposite end of the spectrum, only 35% of infectious disease doctors think they’re fairly paid.
If they could do it all over again, 73% of doctors say they’d still choose medicine.
Medscape’s 2023 survey also asked doctors if they would still choose their specialties. Plastic surgeons were most likely to choose their specialty again.
Here’s a look at the percentage of doctors who’d stick with their specialties:
- Plastic surgery: 97%
- Urology: 96%
- Orthopedics: 95%
- Oncology: 94%
- Cardiology: 93%
- Gastroenterology: 92%
- Ophthalmology: 92%
- Dermatology: 90%
- Radiology: 90%
- Infectious diseases: 88%
Physician Income Trends
The average doctor’s income decreased by 2.4% in 2022.
In 2022, overall physicians’ income levels declined by 2.4%, on average. And with a 40-year all-time high inflation rate, a lot of doctors took home less real income. (Doximity).
The gender pay gap between male and female doctors is 26%.
Doximity reports a 26% pay gap between male and female physicians. Their study reported that a male doctor makes an average of $110,000 more than a female doctor each year, and an average of $2 million more over their entire careers.
However, the gender pay gap was down 2% from the previous year’s survey.
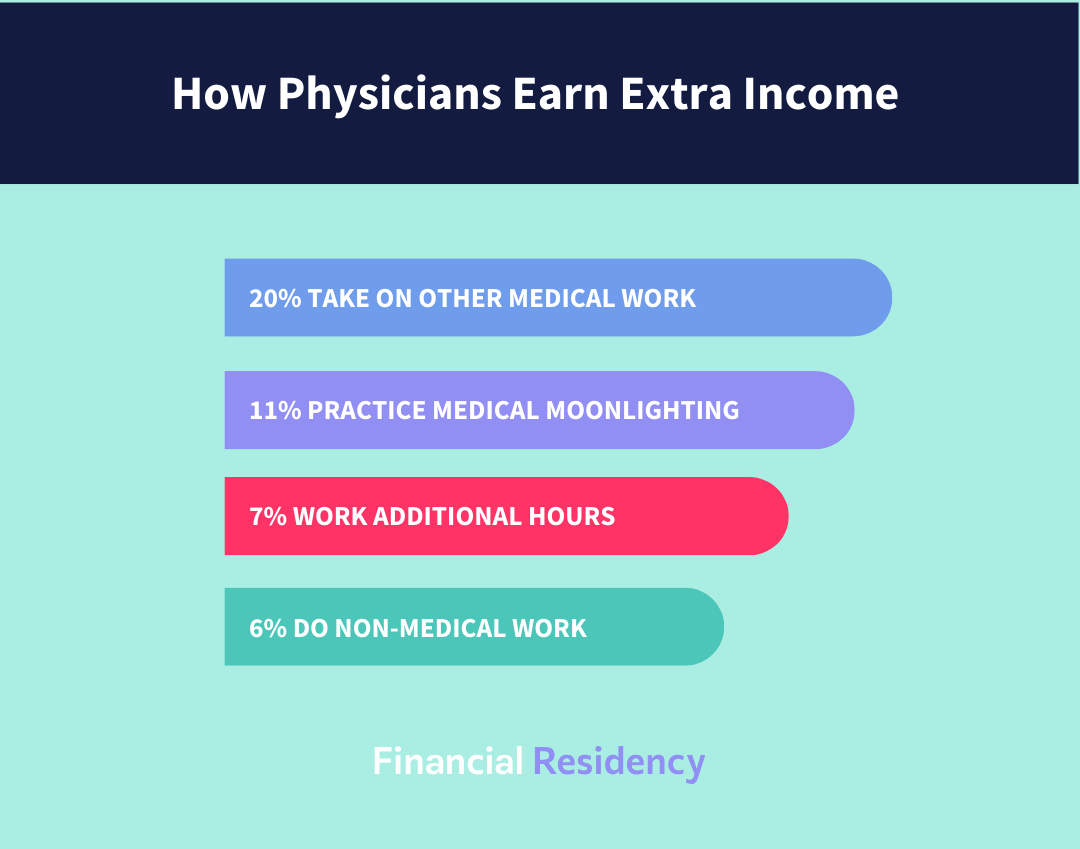
38% of doctors take on additional work to augment their income.
38% of physicians supplement their income with side projects. Here are the top 4 ways doctors earn an additional income:
Physician Spending Trends
Mortgages, health insurance, taxes, and student loan payments are common expenses shared by most doctors. Here’s a look into physicians’ spending habits in these areas.
3/4 of doctors pay for their medical bills with their workplace health insurance plan.
74% of full-time doctors use their own employers’ workplace policies to cover their medical expenses. 9% are on their spouse’s plan, and another 7% purchase an independent healthcare policy (Medscape).
The amount doctors spend on houses varies significantly from state to state.
Thanks to physician mortgage loans, doctors can borrow more for a downpayment than the average applicant, with less stringent proof of income and debt-to-income requirements.
LeverageRx found that doctors in the Midwest spend twice as much on new homes as other buyers, on average.
On the opposite end of the spectrum, they reported that doctors in Alaska only spend an average of 5% more on houses than the general population.
Learn More:
Doctors pay an average of $83,620 in federal income taxes.
Data from Medscape suggests that the average amount of federal taxes paid by physicians each year is $83,620. Meanwhile, doctors who are married filing jointly pay an average of $91,681.
Medical practices spend $600 to $15,000 per month on advertising.
According to PatientGain’s Healthcare Practice Advertising Report, most practices have an advertising budget of anywhere from $600 to $15,000.
Bottom Line
Regardless of the specialty, type of practice, or location you choose, being a doctor is a lucrative and rewarding career choice.
From family doctors to OB/GYNs to specialists, most doctors will earn between $6 to $10 million over the course of their lives (Medscape).
That’s enough to live comfortably and make a positive impact on your patients, however, and wherever your medical career path takes you.
For more information, take a look at the sources below to view all the data featured in this article.
Resources:
- Occupation Employment and Wage Statistics, BLS
- 2023 Physician Compensation Report, Doximity
- Medscape Physician Compensation 2023, Medscape
- Healthcare Practice Advertising Report, PatientGain
- Physician Education Debt Report, AAMC
- How Much Doctors Spend on Homes, LeverageRx
- Physicians and Taxes Report 2023, Medscape